WELCOME JEREMY O'SHEA TO PRIDE SEEDS

Enhance your knowledge and stay ahead with PRIDE SEEDS Corn and Soybean School videos.
Browse our selection of products below
___________________________________________________________________________________________________________________________________________

2024-2025 PRIDE Seeds Product GuideYou can find all of our products on the website, including supporting performance data and create your own personalized guide called My Guide. You can also download the digital version of our printed product guide which includes product comparison charts. |
SHOP THE PRIDE SEEDS E-STORE
-7.png?sfvrsn=87920db3_3)
STAY UP-TO-DATE WITH PRIDE SEEDS LATEST BLOGS, NEWS AND ARTICLES
It’s time to talk fungicides
With recent showers, extended periods of overcast and humidity, we should be aware to scout corn fields that have faced extended periods of leaf wetness and helped support the infection of the Tar Spot disease in Southern Ontario this season.
Where?
Specifically, where the crop is most advanced into canopy closure reaching V8 and beyond. Likely to exist along field edges and stressed areas first. Later planted fields are of lower risk.
When?
If conditions persist, we could expect to see the first pycnidia in canopy within 2 weeks. (July 8th-15th)
How?
Verify lesions with large flags and 'painting' or drawing circles on leaves to look for disease progression.
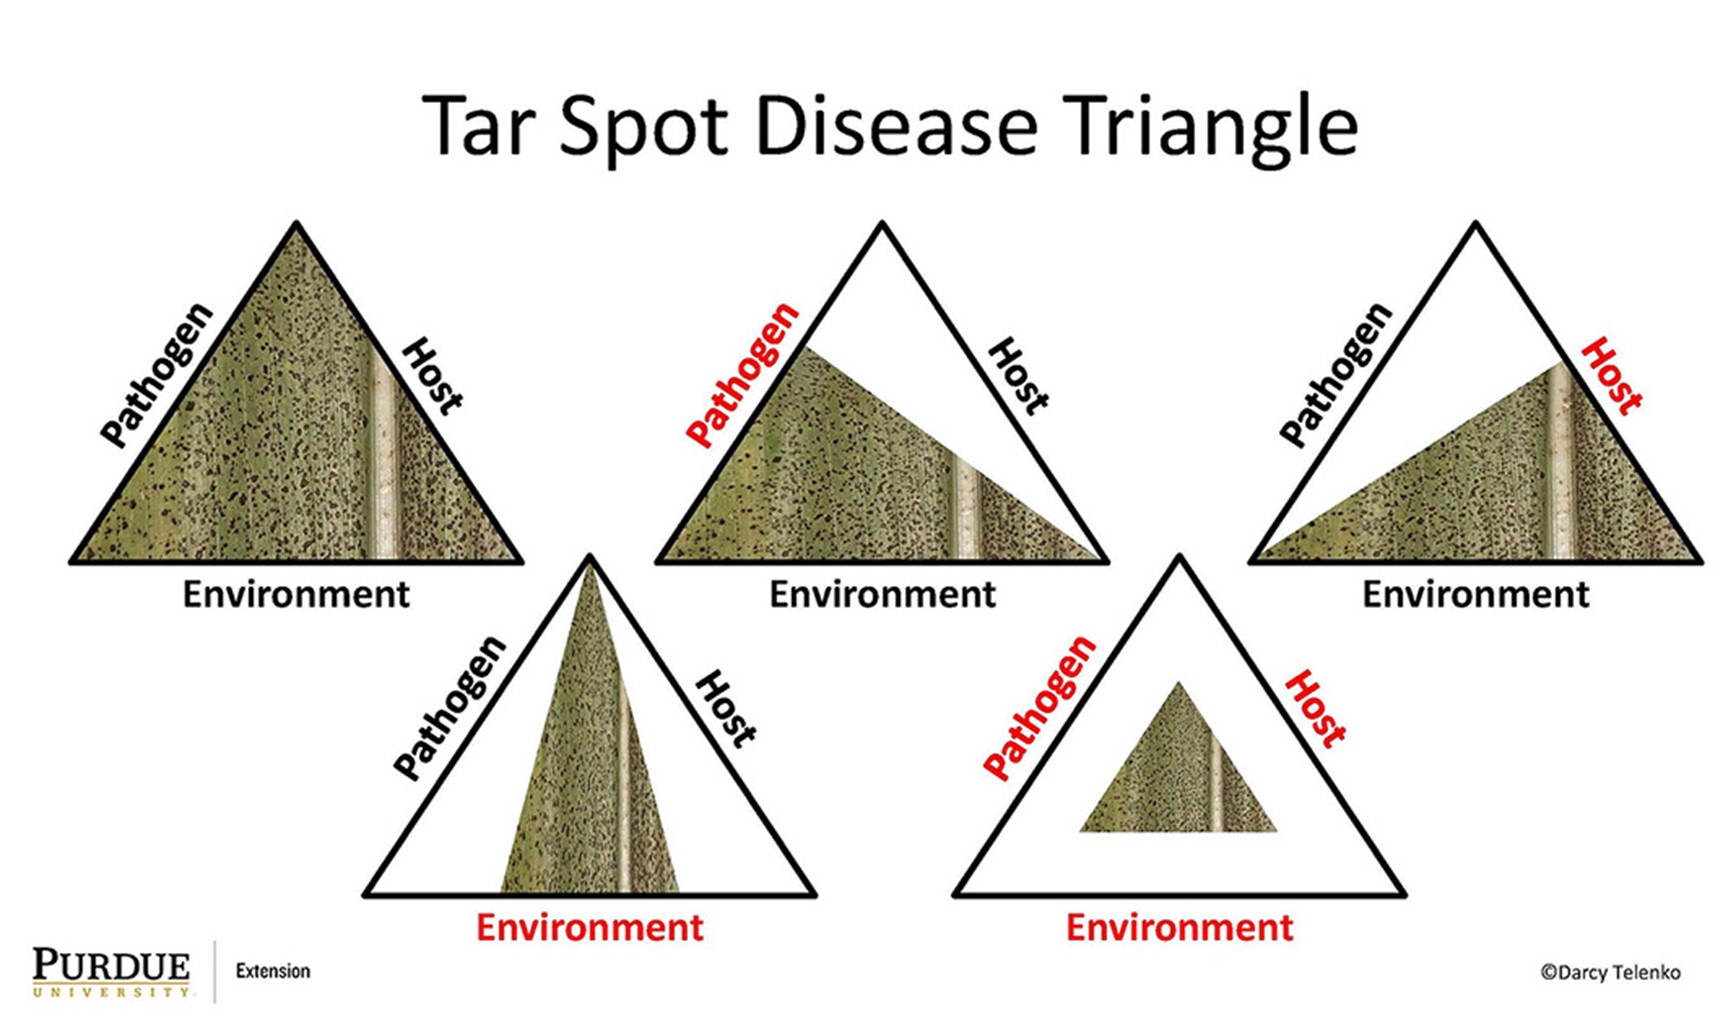
The disease and risk of the disease doesn’t exist without important components of the disease triangle. These include:
- Pathogen (bacteria/spores/ residue/ infection point)
- Environmental conditions suitable for disease development (excess moisture/ humidity)
- Susceptible host (corn hybrid)
Without all three points disease will not occur or be economically damaging.

Figure 1. The tar spot disease triangle is influenced by the interaction of the pathogen (Phyllachora maydis), host (corn) and environment. If one of these components is modified the resulting disease incidence and severity will change. RED = component
modified in the triangle, such as reduced pathogen inoculum, less susceptible host, and/or unfavorable environment for disease.
Many areas had confirmed presence of the disease last season, with relatively low pressure throughout the field, and appearing later in the season. It is tough now at this point to say the severity of the disease this season, but field history, rotation
and boots on the ground will be the most important tools to make decisions around disease mitigation (fungicide applications).
Here are some essential Tar Spot points:
What is tar spot?
- First confirmed in the U.S. in 2015 and was confirmed in SW Ontario in 2020
- It overwinters as stromata on corn residue and then produces spores that are spread by wind and rain
- Ideal weather conditions include:
- Temperatures between 15 and 25 degrees C
- Humid conditions
- Long periods of leaf wetness (7+ hours)
Why is tar spot important?
- Causes rapid loss of green tissue
- Reduced ear size
- Poor kernel fill
- Significant yield loss
- Increased lodging

Identification
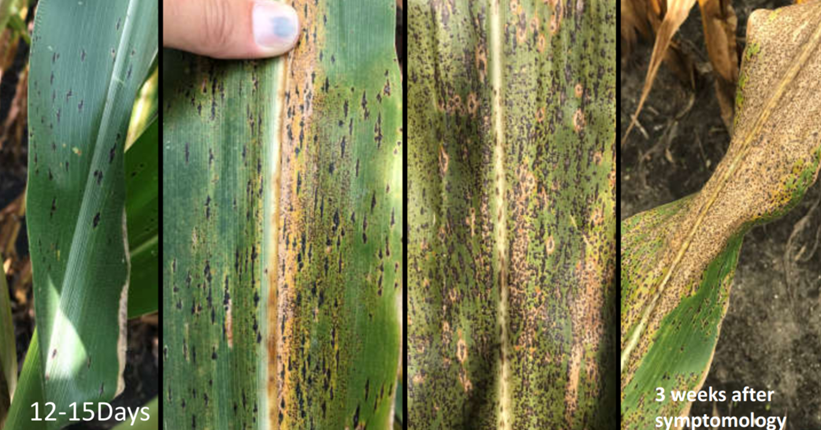
- Small raised black spots on the surface of leaves that cannot be scraped off (these are stromata)
- The stromata can spread from leaves to sheaths, husks and stalks
- The spots spread into more irregular shapes and can develop into a brown halo or “fish eye”
Management Strategies
- Crop rotation
- Burying residue
- Differences in hybrid genetics have been observed in US and Ontario
- Fungicide applications: VT or tassel stage. Research continues if 2nd application is warranted
- Maintain high levels of fertility especially nitrogen.
Another resource that can be utilized is the Tarspotter app to help make recommendations for fungicide applications. It uses GPS coordinates to determine if weather has been favorable for the development of Tar spot fungus during corn
flowering in a specific field. Models in the app use temperature, dewpoint, humidity, and precipitation to predict favorable conditions for most corn growing regions. Based on these predictions and crop phenology, a site-specific risk prediction is
generated. This tool is for guidance only and should be used with other sources of information and professional advice when determining risk of tar spot development.
As always, if you have any additional questions don’t hesitate to reach out to a member of the PRIDE Seeds team.
TAKE PRIDE IN YOUR INBOX
Expert advice, news and information
THE PRIDE SEEDS ADVANTAGE
Farming is one of the most demanding industries in the world, subject to a variety of factors such as time, weather, and global pressures. You know this every time you look out the window and think about the field in front of you. Growers and dealers deserve an advantage: The PRIDE Seed Advantage.
LEARN MORETHE PRIDE SEEDS ADVANTAGE
Every year PRIDE Seeds works hard to produce leading-edge products that enable success where it matters most, on your farm. Our dedicated team strives to provide sales expertise, agronomy support, quality production, and service tailored to meet your needs.
LEARN MORE

Leave a commentOrder by
Newest on top Oldest on top